Apollo 11 Skymap
Background
People from any point in history envisioned how the moon really appeared or behaved. The first man mission, Apollo 11, was the first direct encounter with the moon. I used the Digital Public Library of America's API to use 500 data references to be represented as "moons".
Research & Discoveries
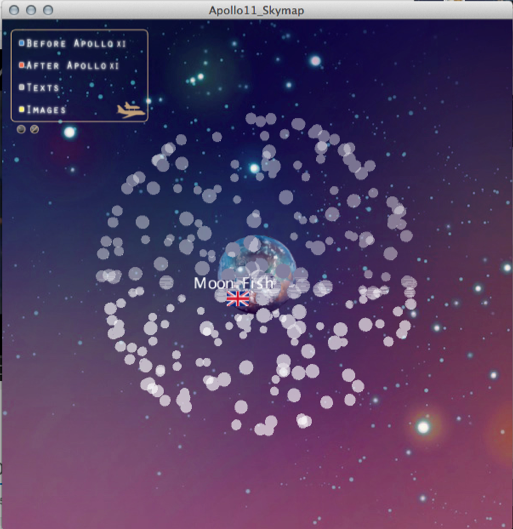
I wanted to compare how the moon was visualized before 1969, when the Apollo 11 mission was launched, and after 1969. To further my goal, I shaped the datas into spheres that orbits around the Earth. The size of the sphere is determined by the data's metadata. When hovered, each sphere displays the title of its source. The menu on the left allows the user to filter the data information. If a location in the data entry is found, then the country's flad is displaced when hovered over as well.
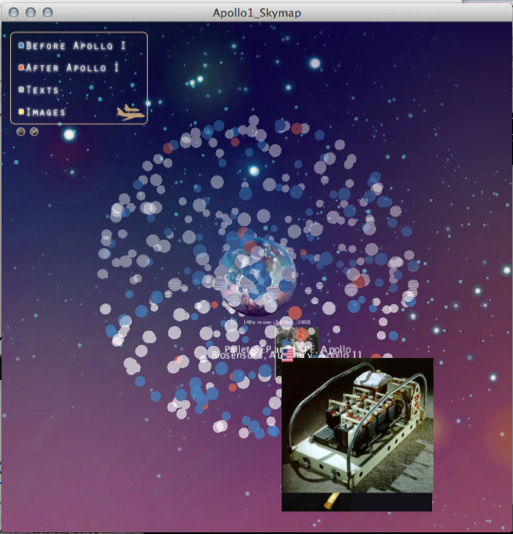
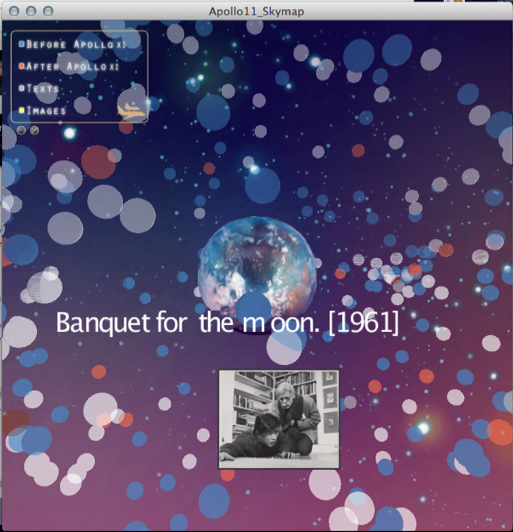
I noticed that data from before Apollo 11 tends to be works of literature or paintings that may refer to the moon. These are cultural and individual representations of the moon in different time periods and countries. Data from after the Apollo 11 tends to be of photographs of important scientific figures or modern equipment developed for space use. The new data have a more scientific and realistic approach that transitions from the dreaming of going to the moon.
Solution
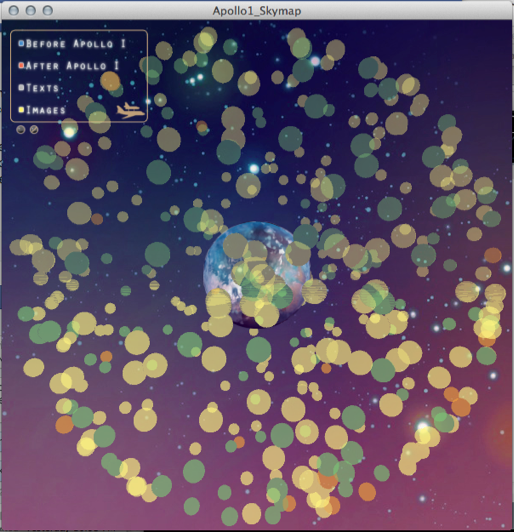
The menu has 4 different filters can be turned on separately or together: Before Apollo 11, After Apollo 11, texts, and images. Each represented by the colors of blue, red, grey, and yellow respectively. In the case where two filters are toggled on, there might be a blending of colors within the data entries. For example, if a spwhere has an image data from before the Apollo 11, then a combination of yellow and blue make a green sphere. The menu also allows thumbnails of the data to be viewable when hovered. It should be noted that some pieces of data do not have a location, date, or thumbnail.