Zones of Atlanta
Background
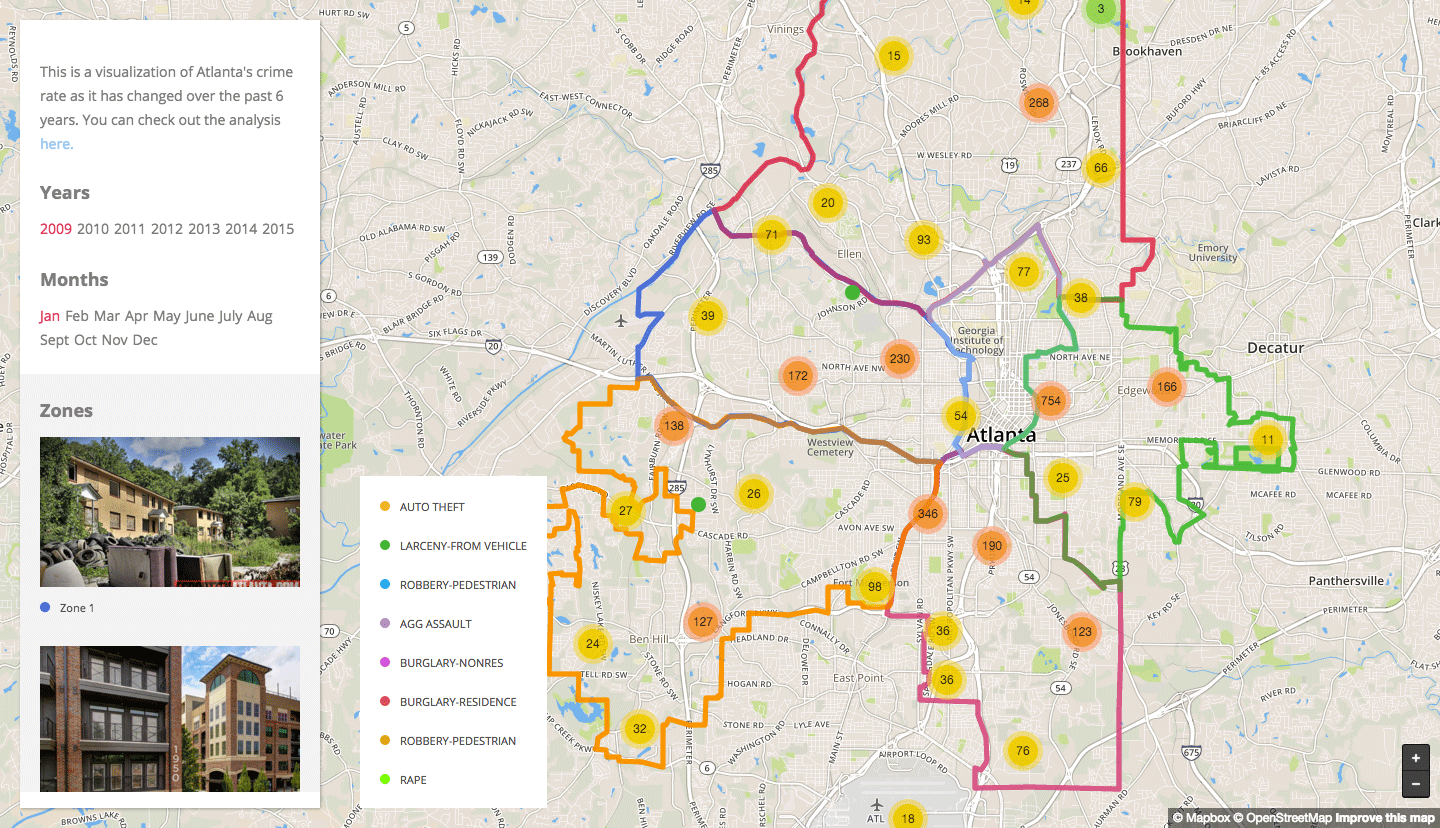
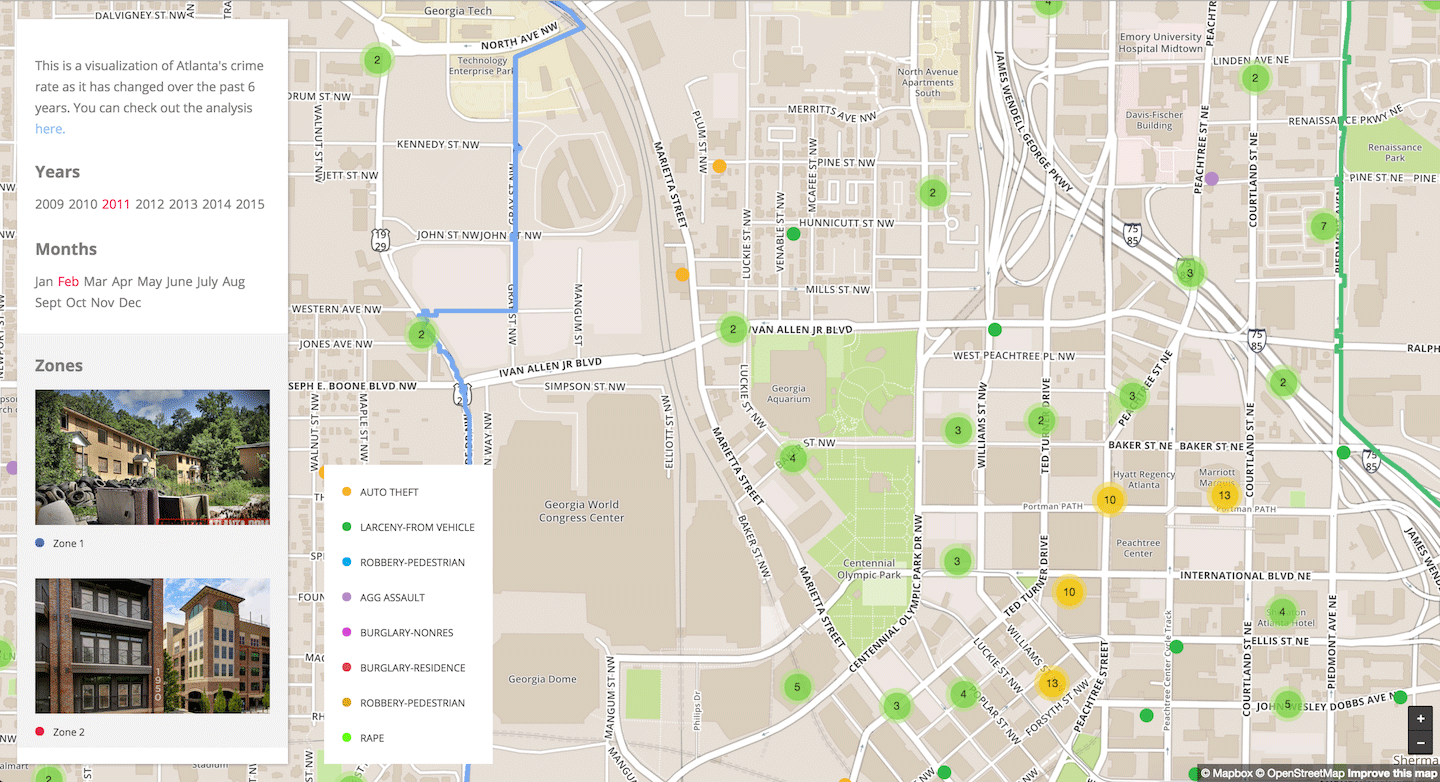
Atlanta in the last couple years, has made their crime data public. Zones of Atlanta takes this data and provides context to the crimes in order to create meaningful visualizations.
Problem
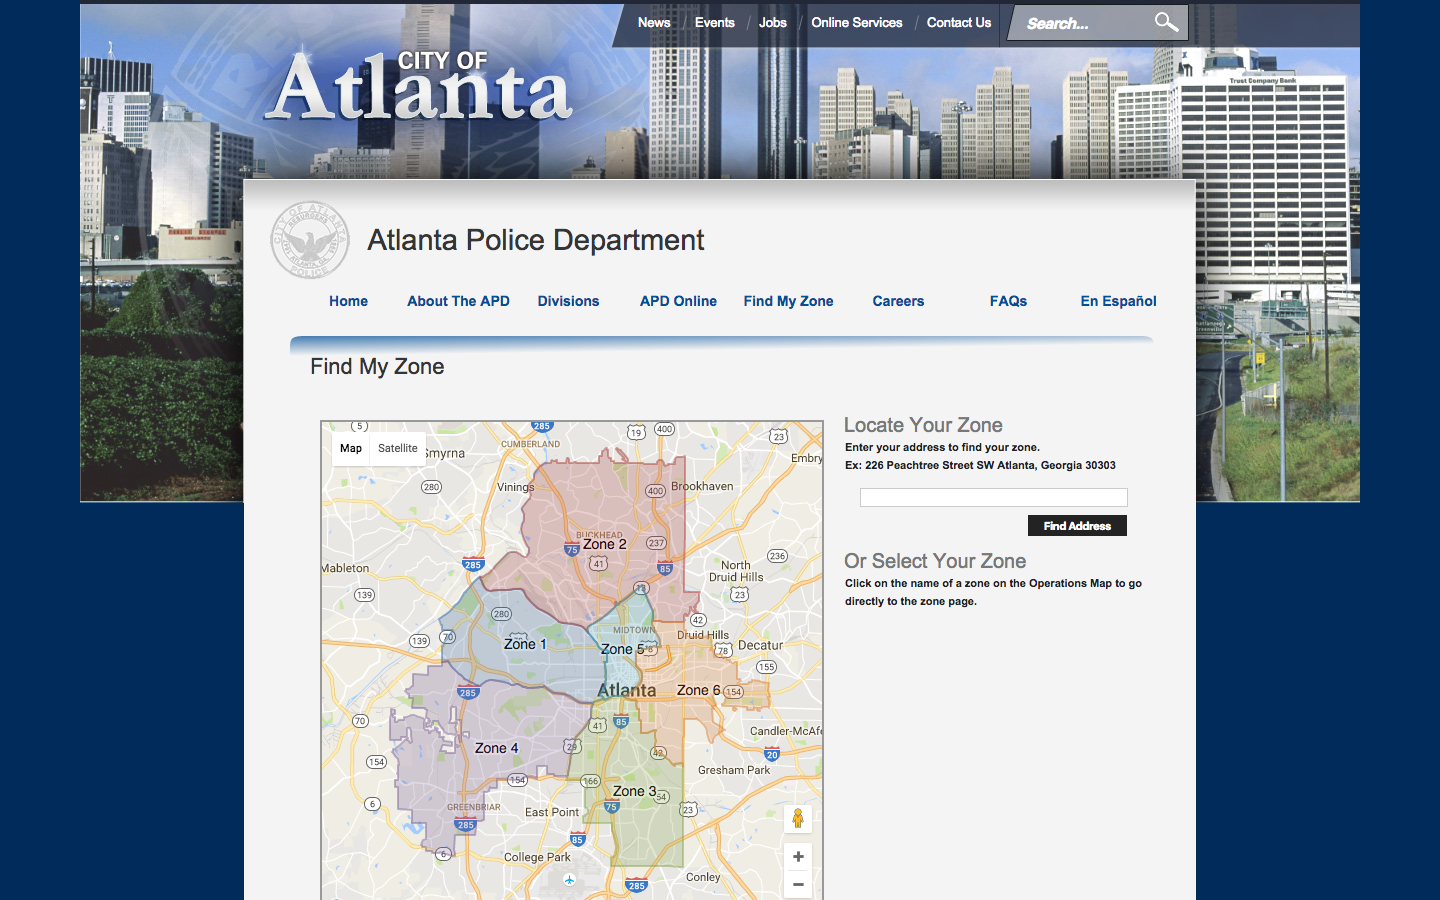
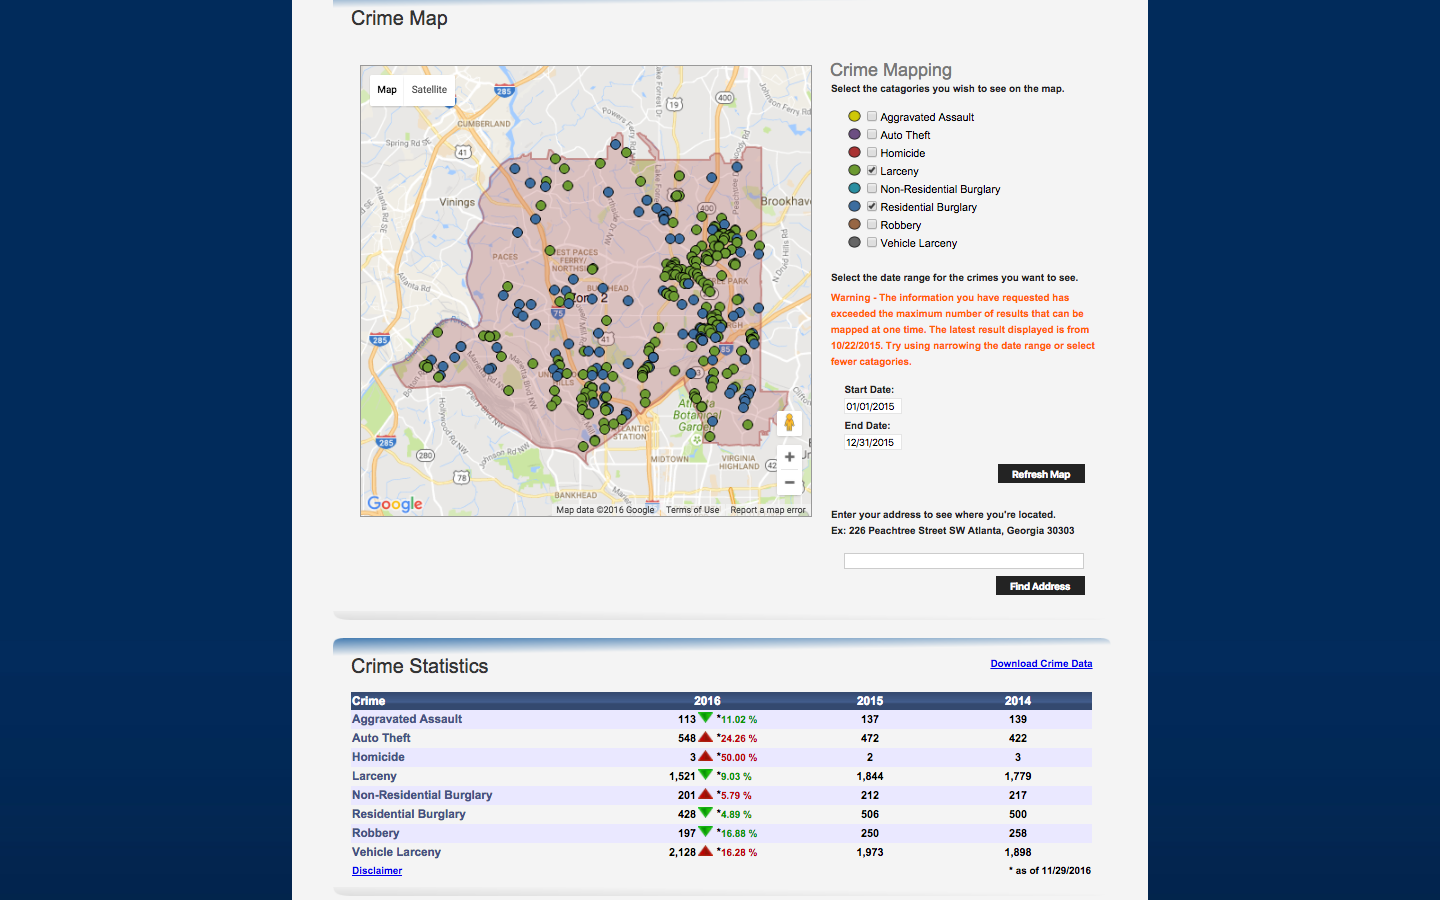
Data visualization for such public records certainly exist on the city of Atlanta website as well as other crame tracking websites. The project goal was to improve on exisiting data visualizations for Atlanta crime and to reorganize them to provide meaningful data. The background and zones of Atlanta crime is better understood to the common people and new Atlantians when combined with cultural and historical information about the city.
Research
Balancing data by location while providing background knowledge is a complext problem. One of the most important ways to approach this was to talk to data and crime analysis in Atlanta, new Atlantians, and new Atlantaians.
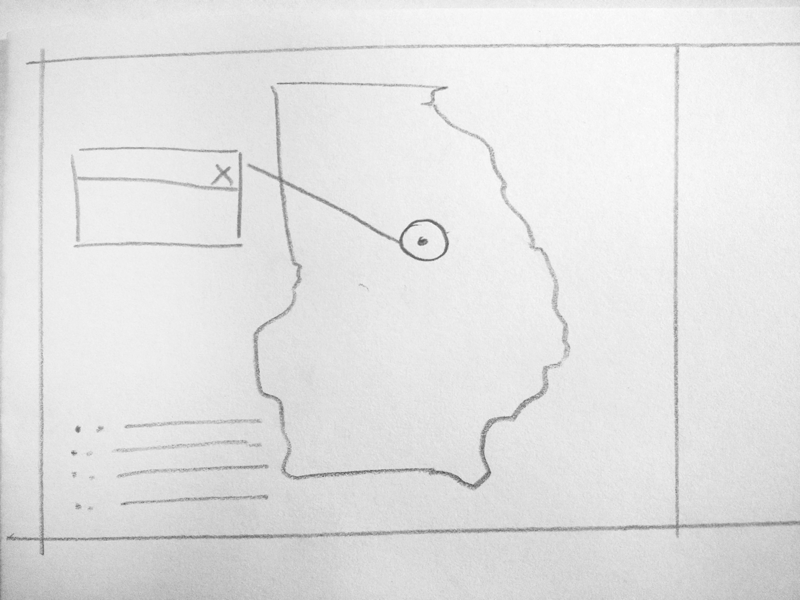
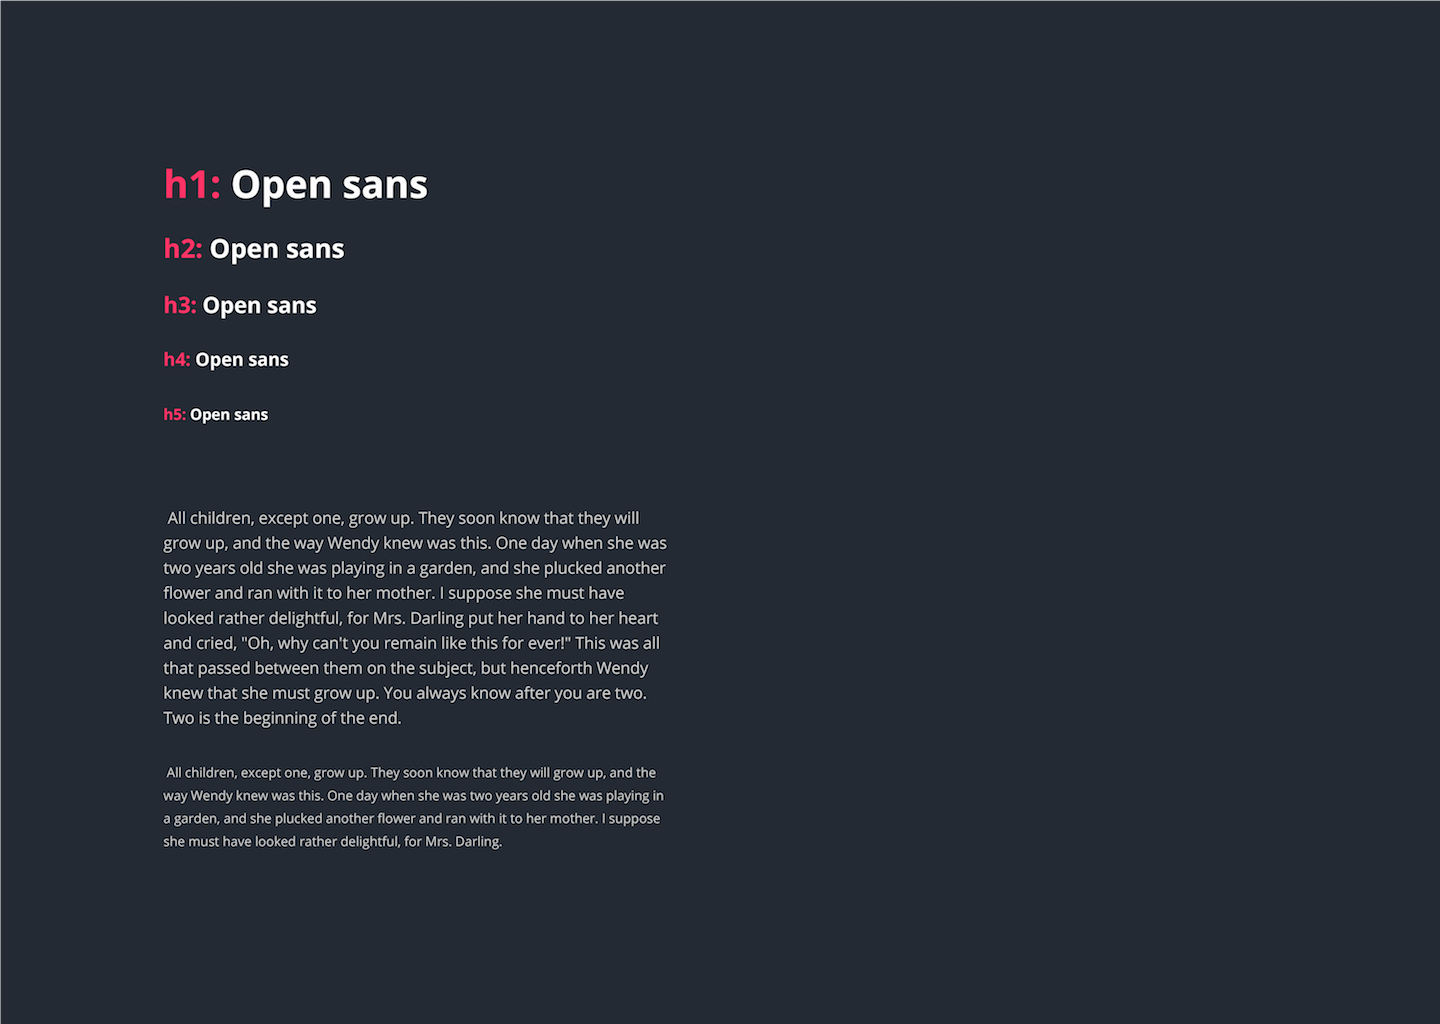
The initial sketches varied in abstractness and content as a project challenge was to present information efficiently and organized. Color and layout is important in creating a distinct data and visual architecture.
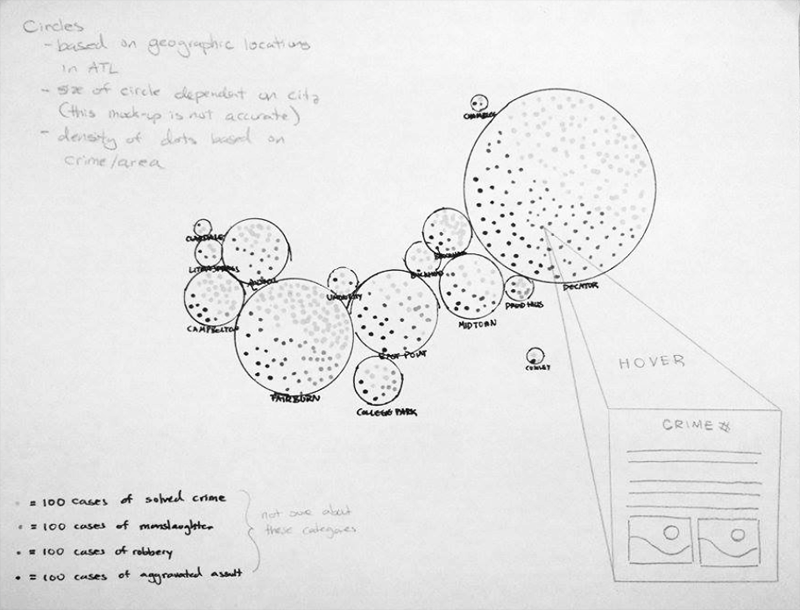
Mock Ups
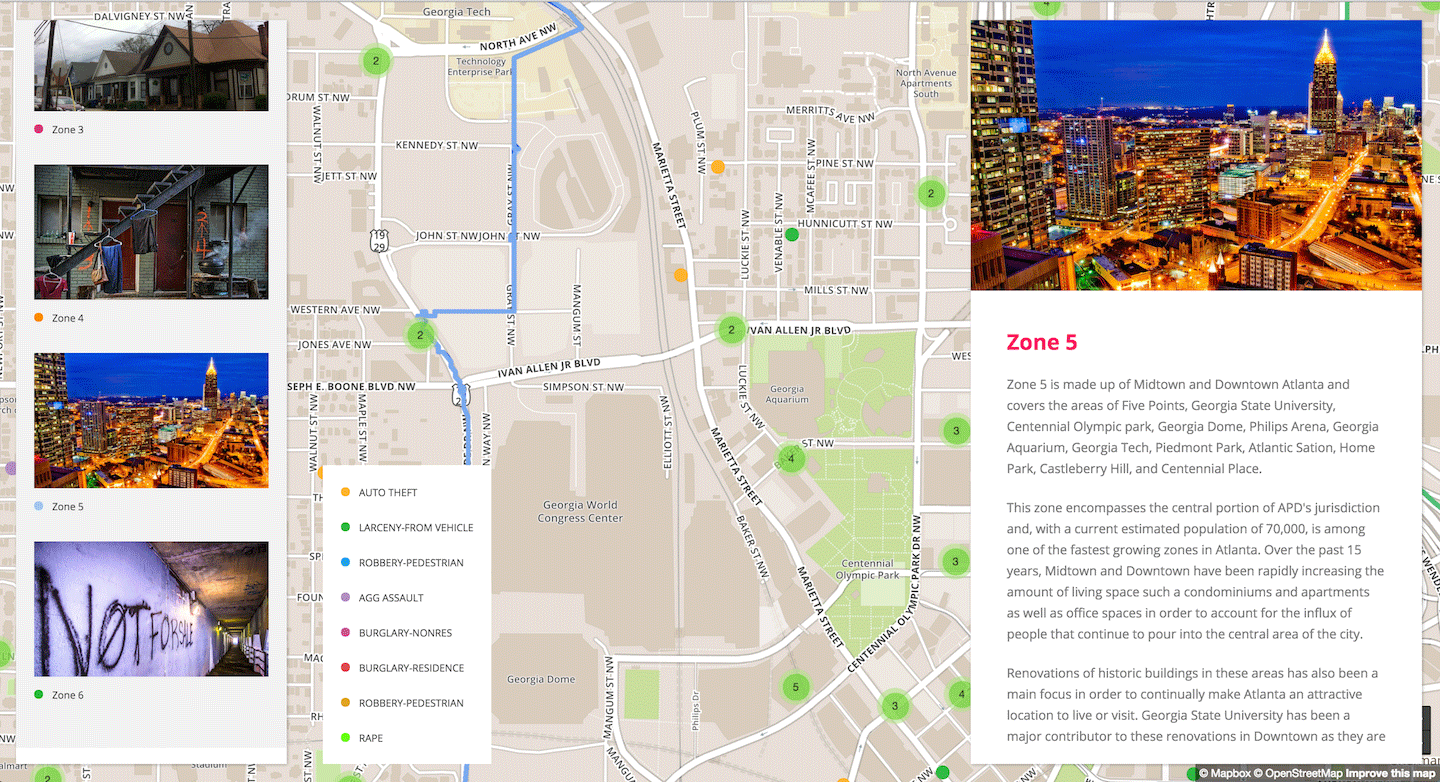
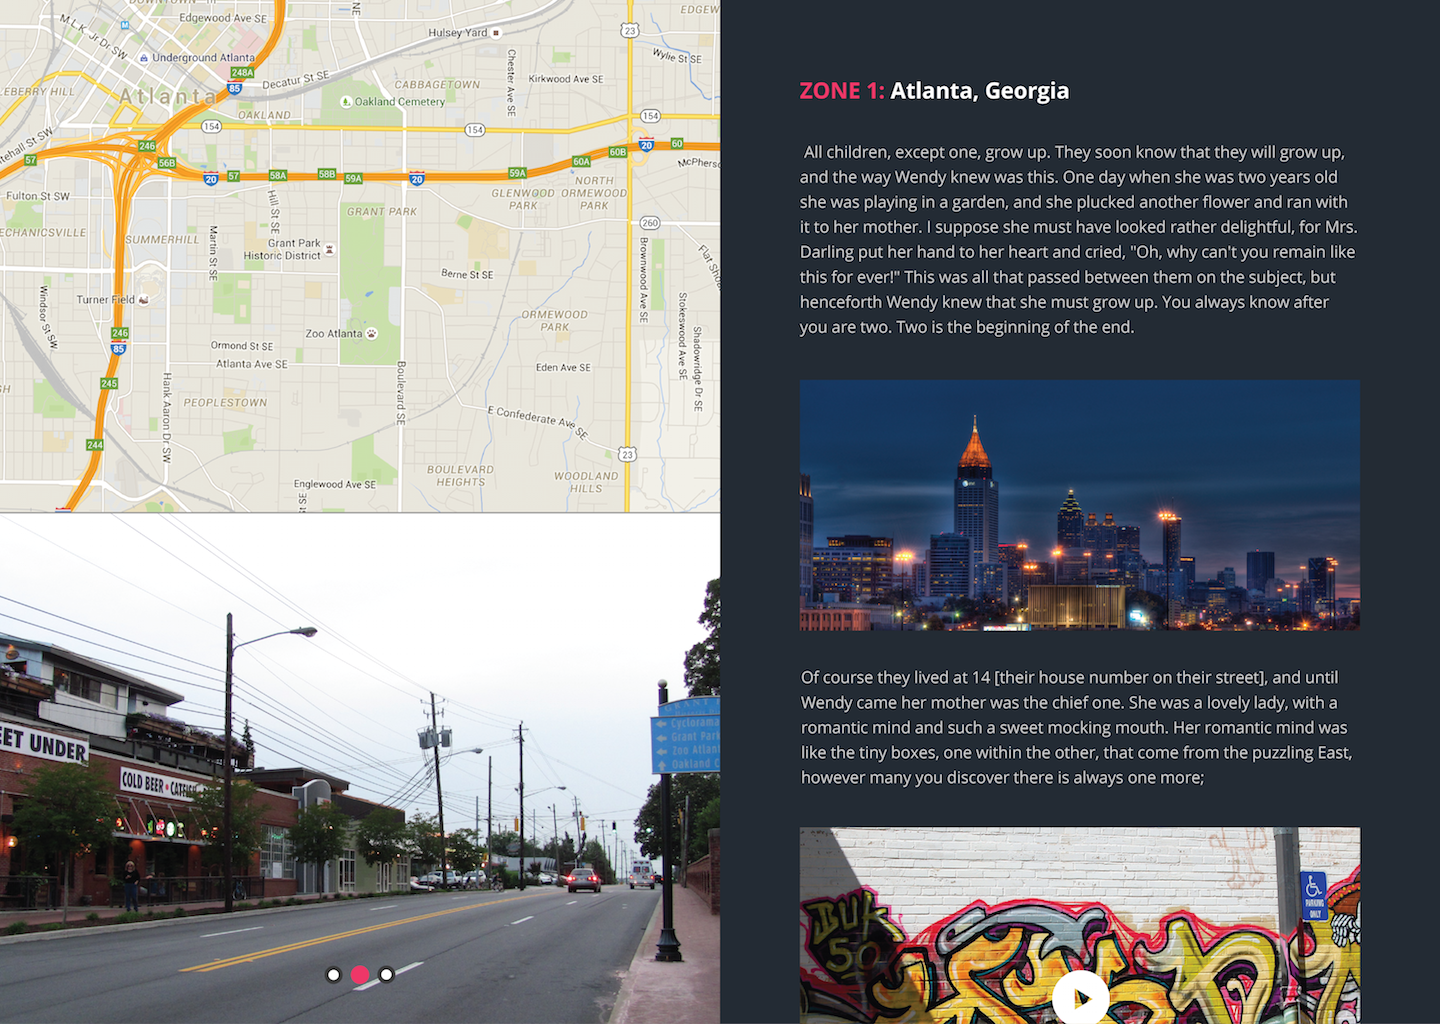
In the mock ups, the detailed view was intended to narrate the types of crimes that may associate to that zone location and its historical context.
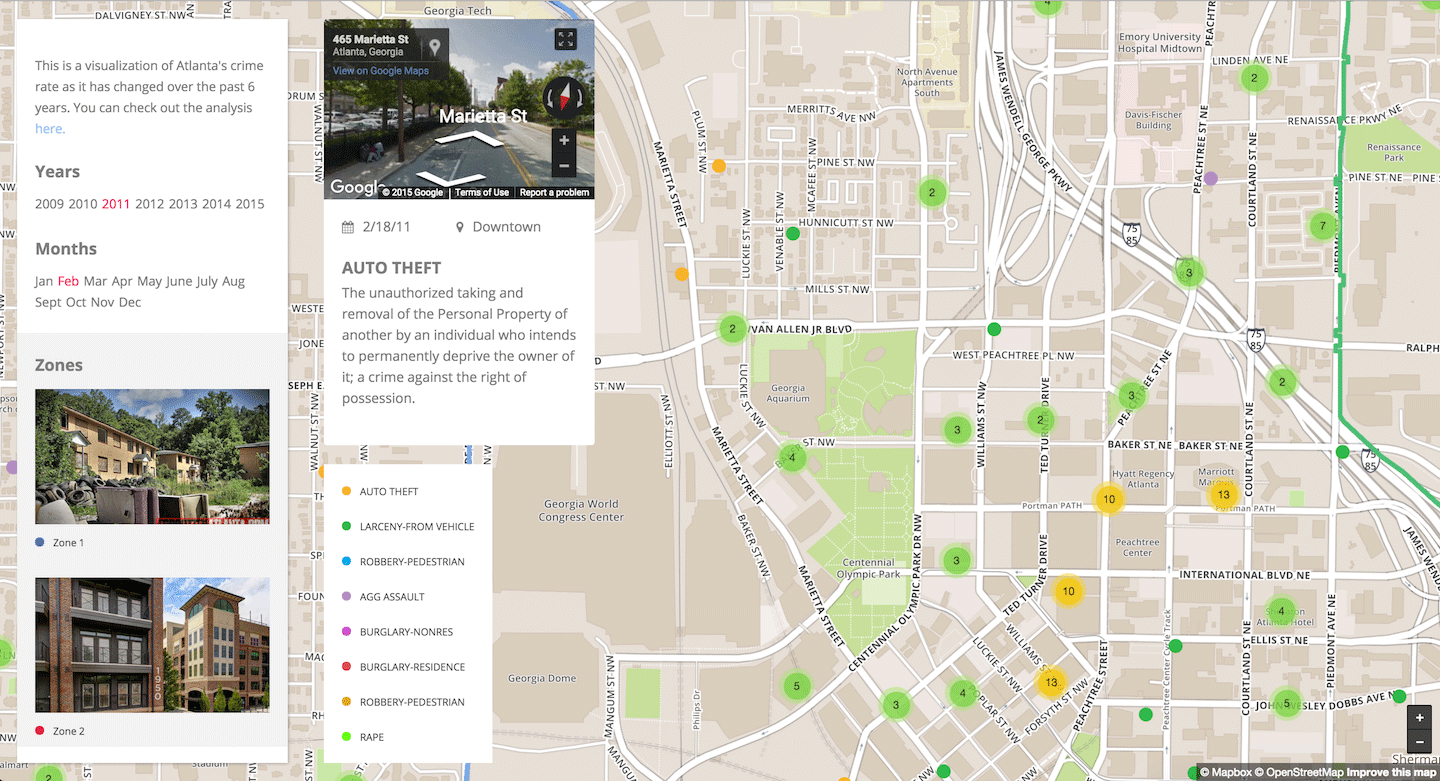
Solution
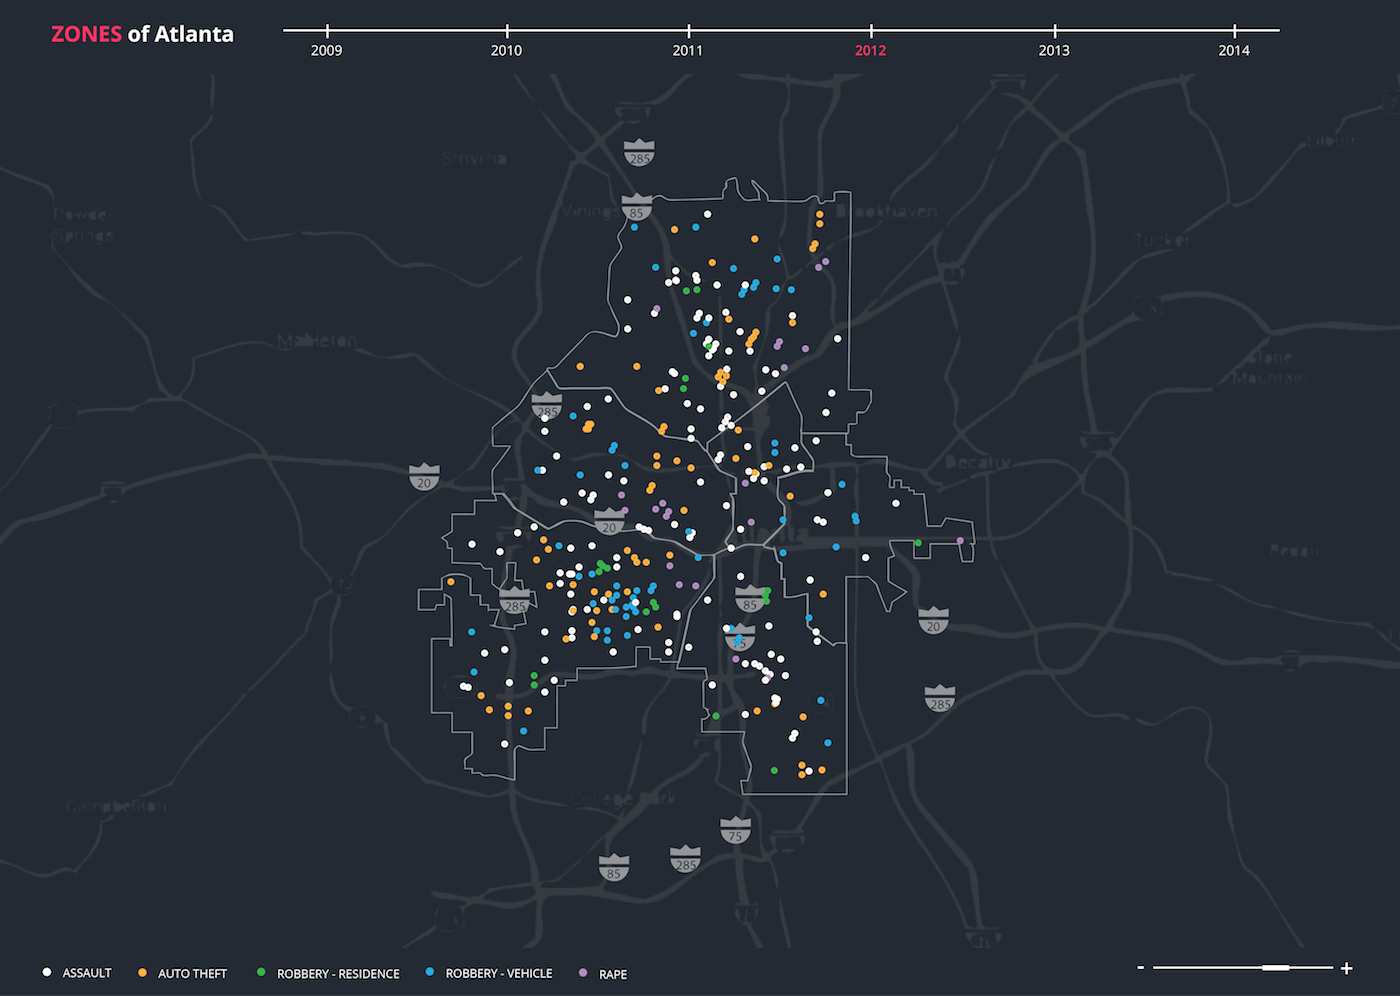
After putting the important features such as the map, the individual crime data panel, and another panel for zone information, the team was able to focus on iterating the interaction and flow of the project
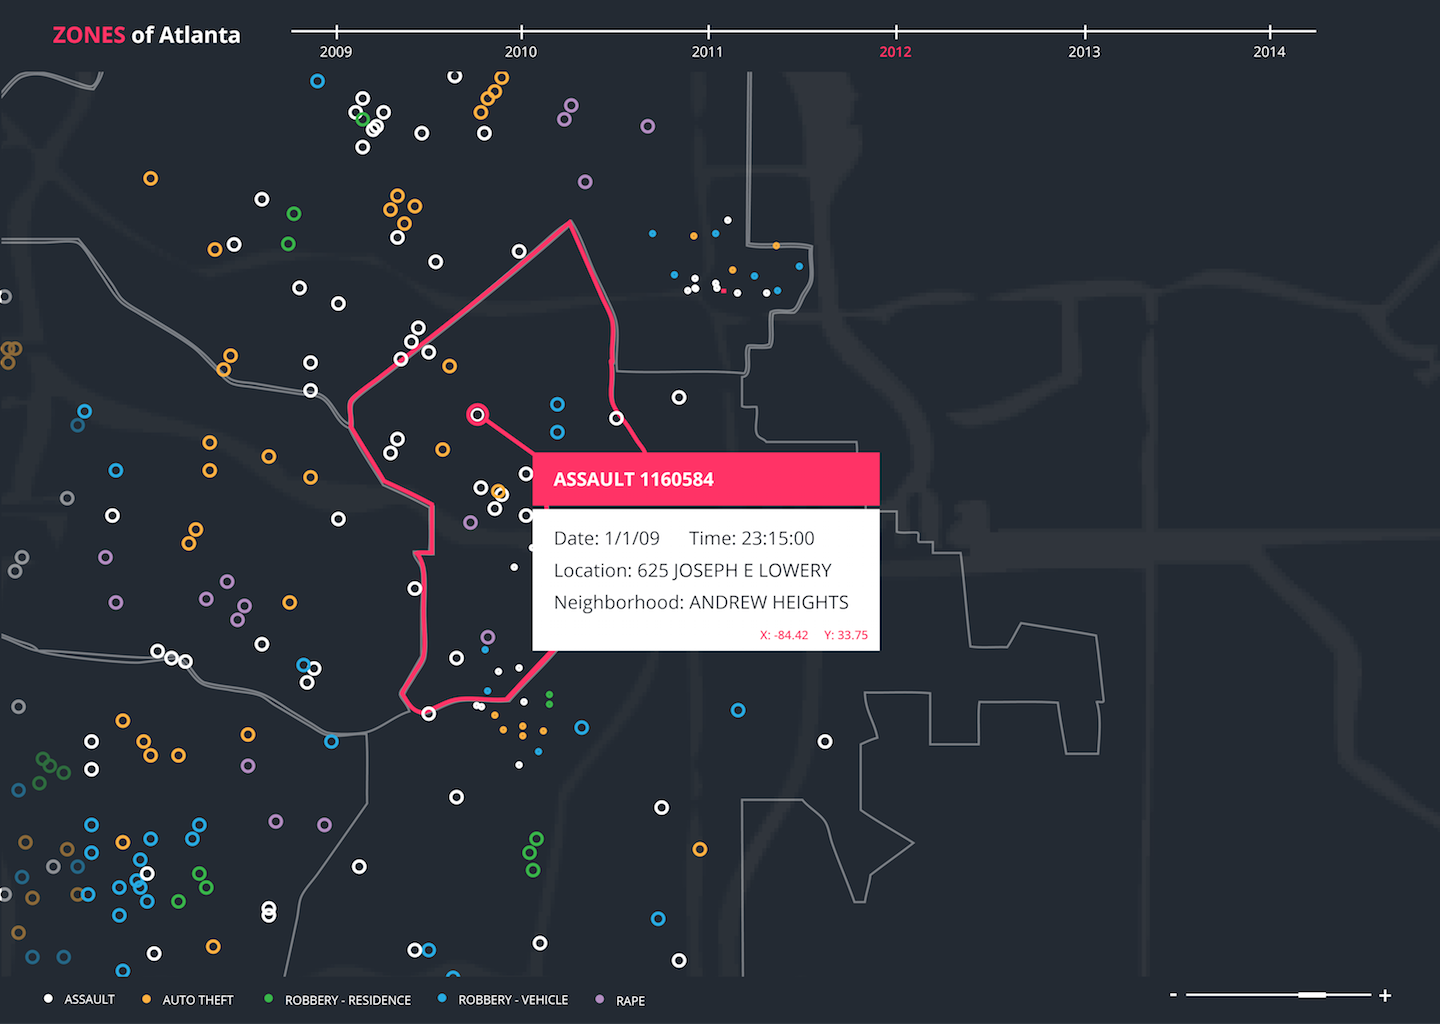
In the final iteractions, the detail view was taken away and condensed into a right rail. The created a detail panel that provided socioeconomical information on the zones along side the map-based crimes. Street views and analytical data was also added to make up for the now condensed detail view. The styling was also changed for readability.